Measuring FSK With a Mixing Reciprocal Counter

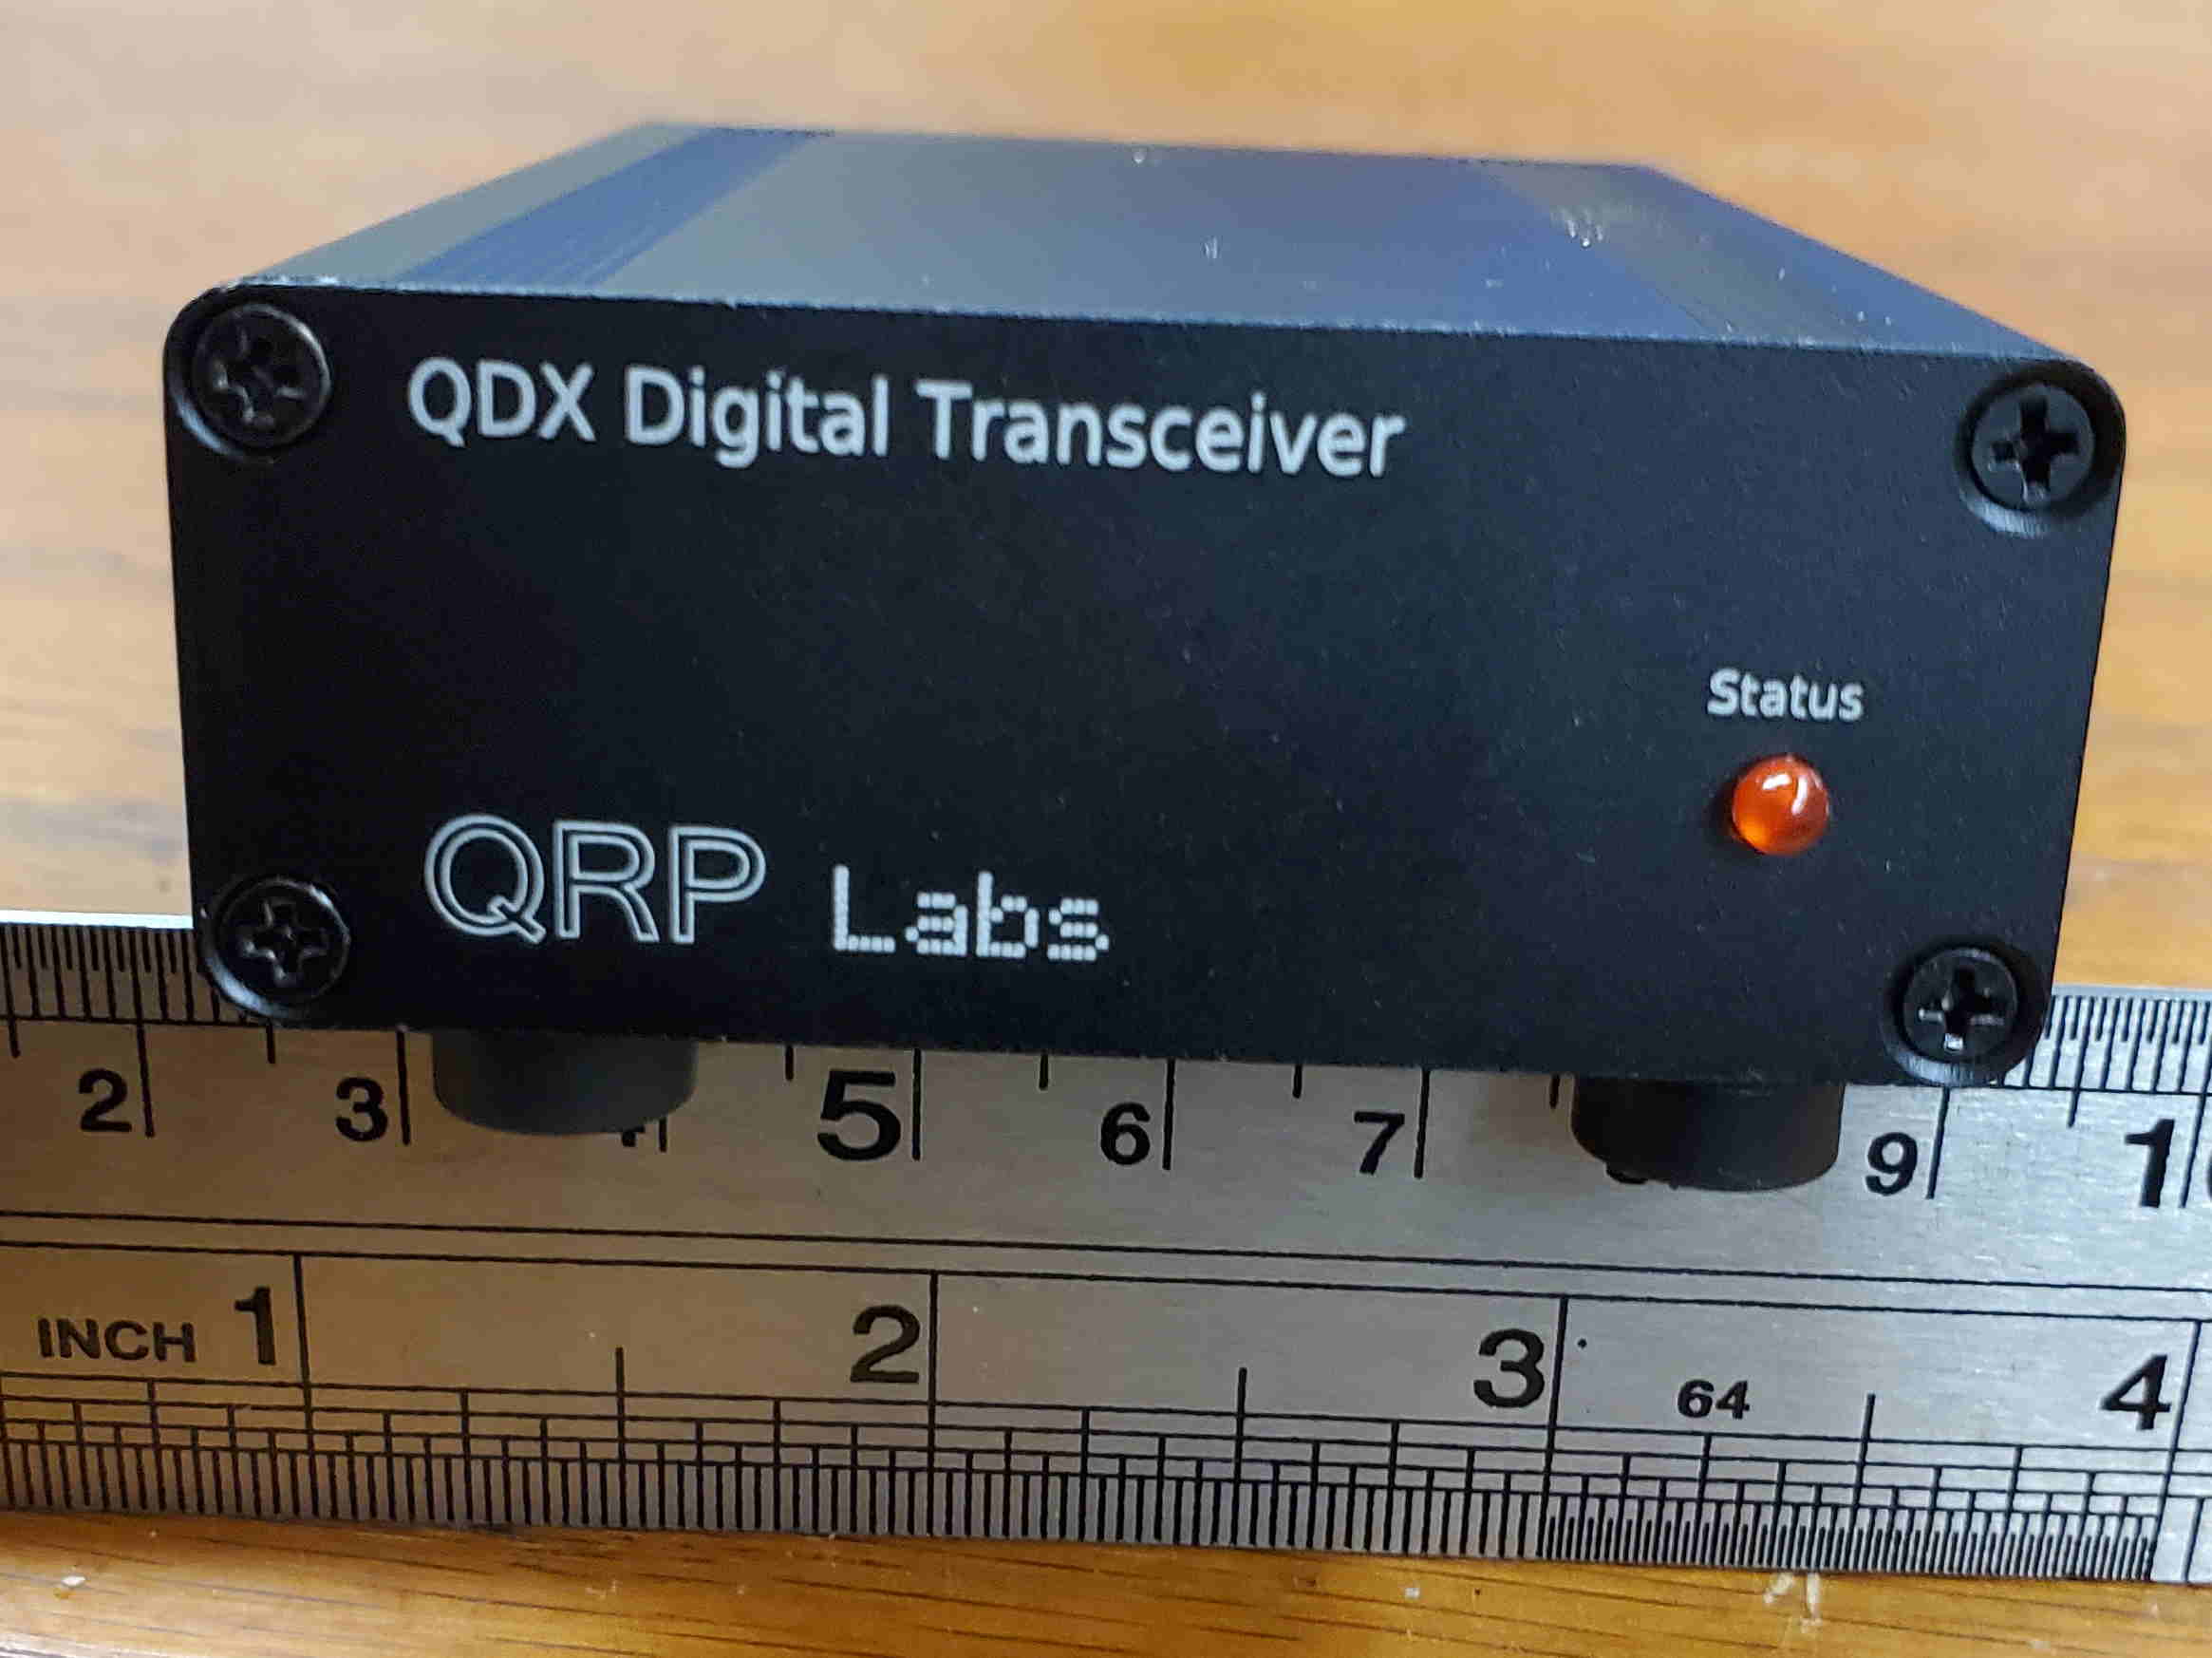
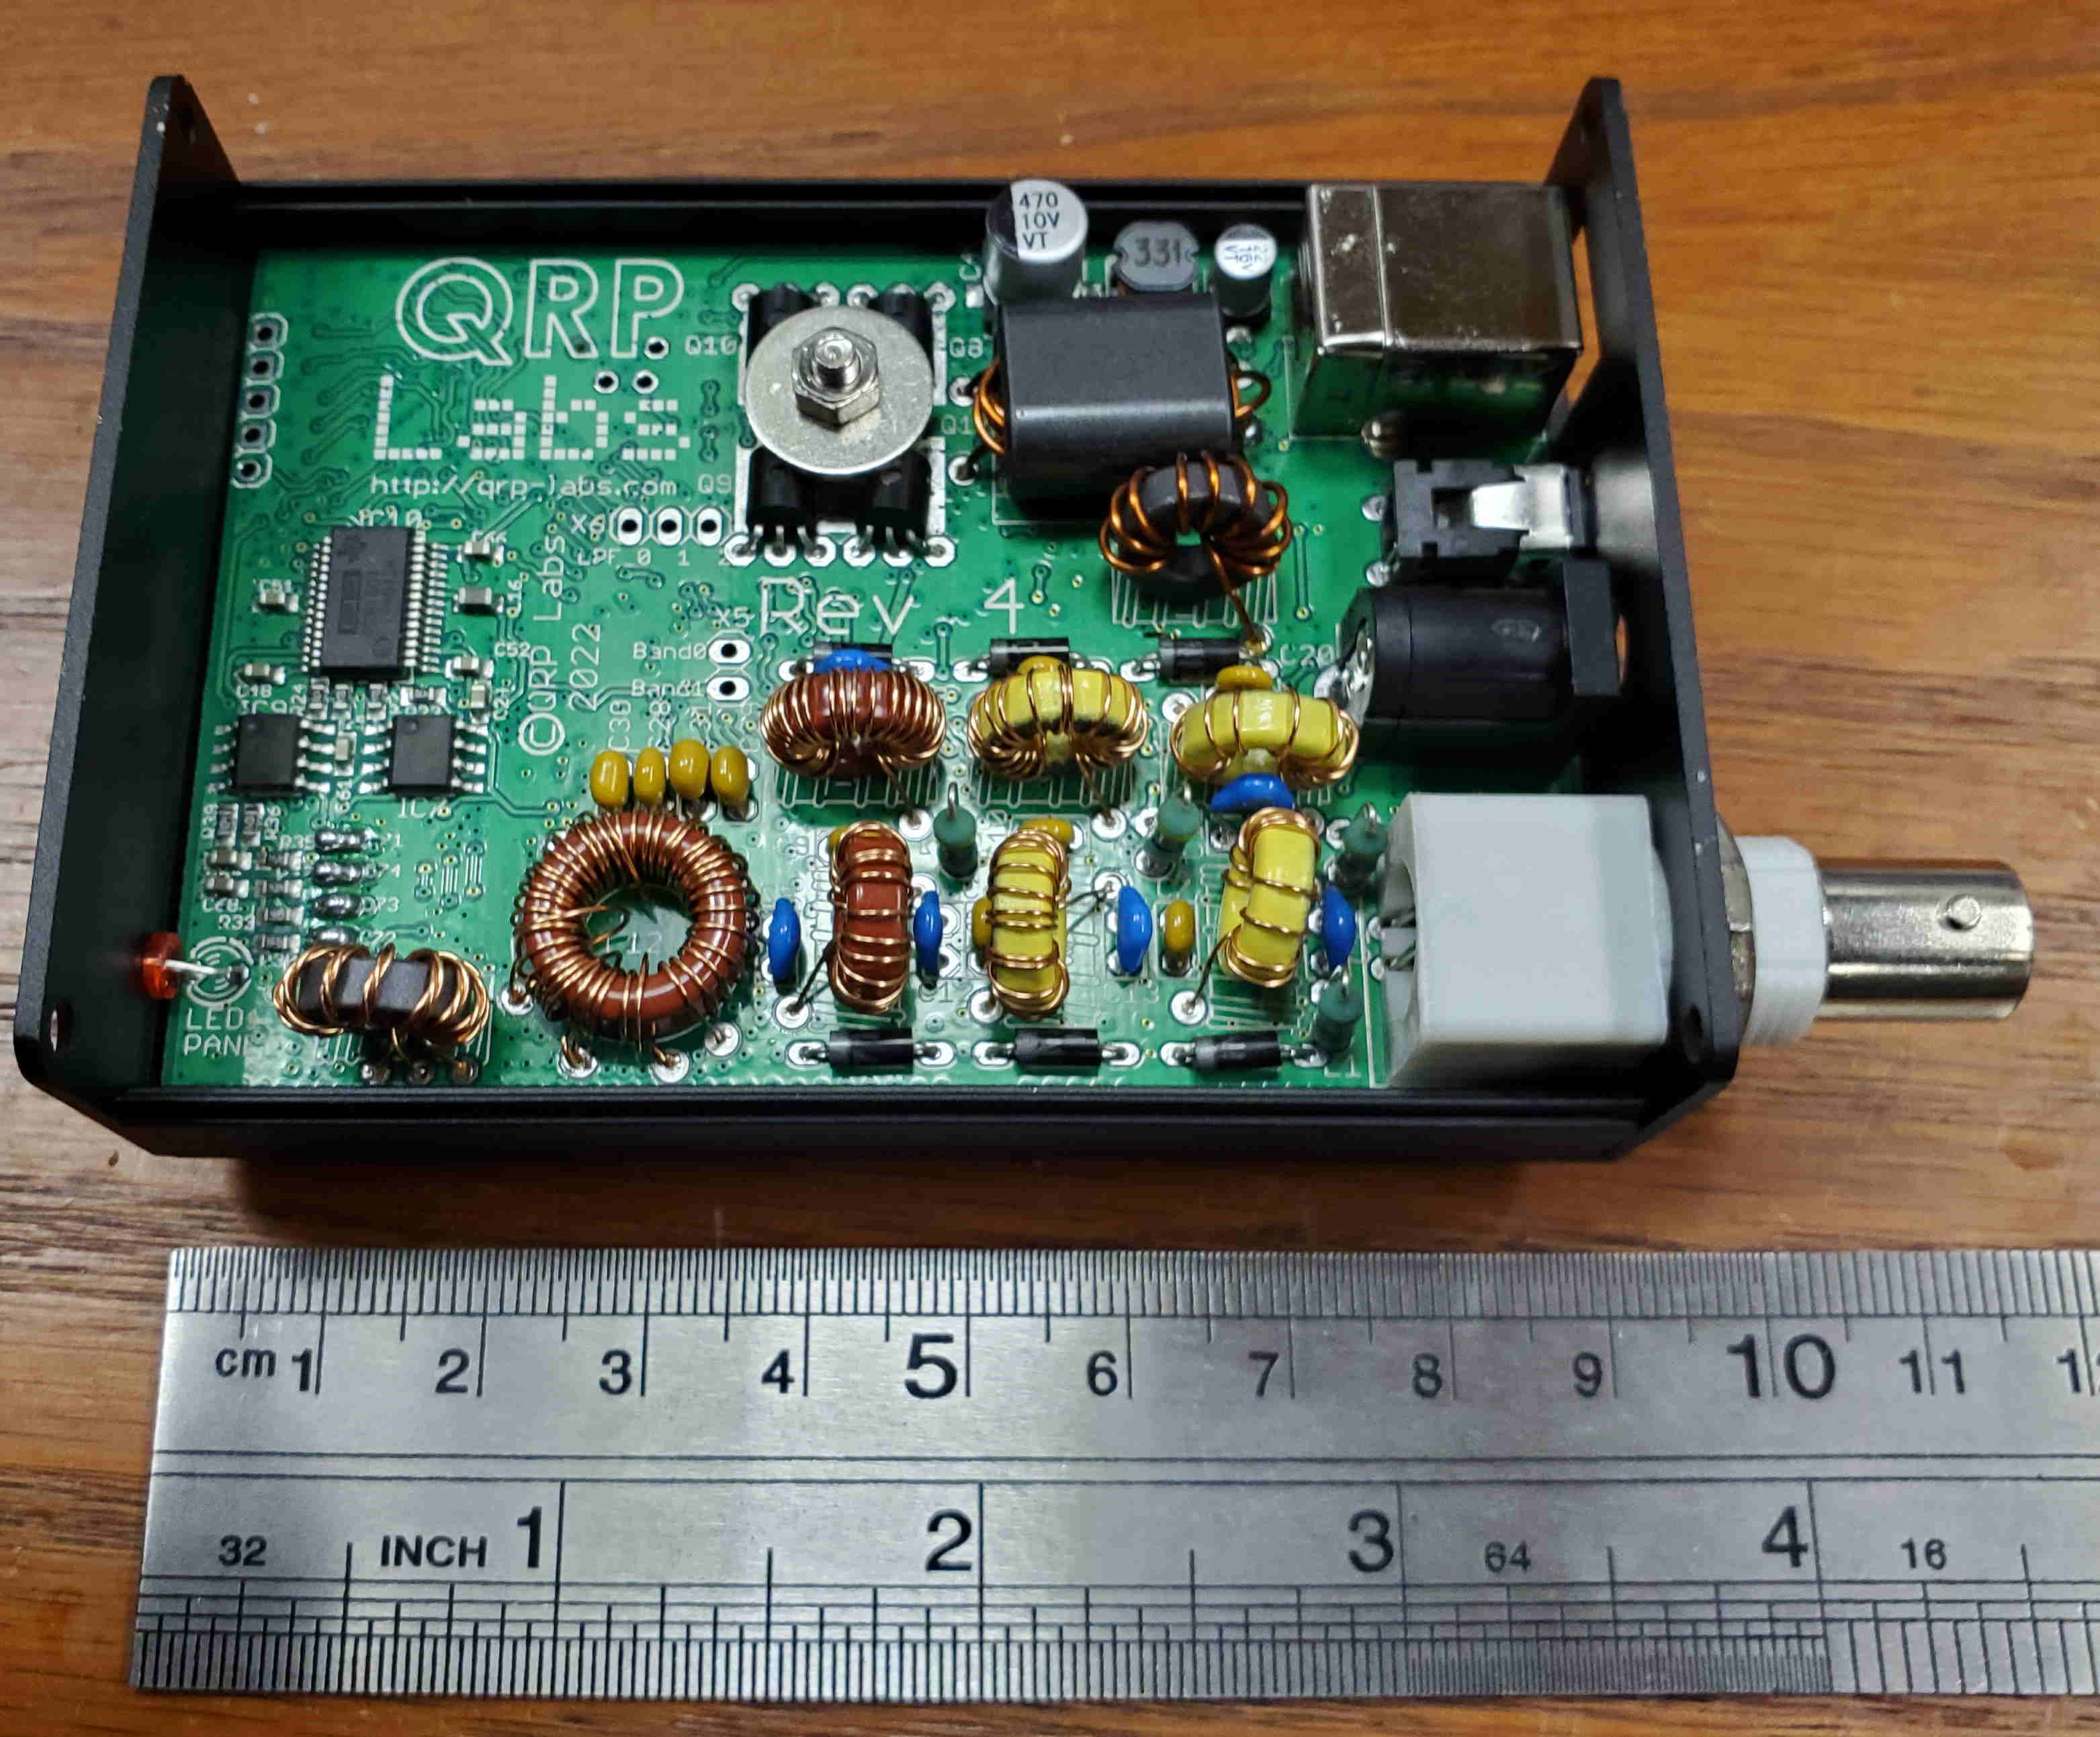
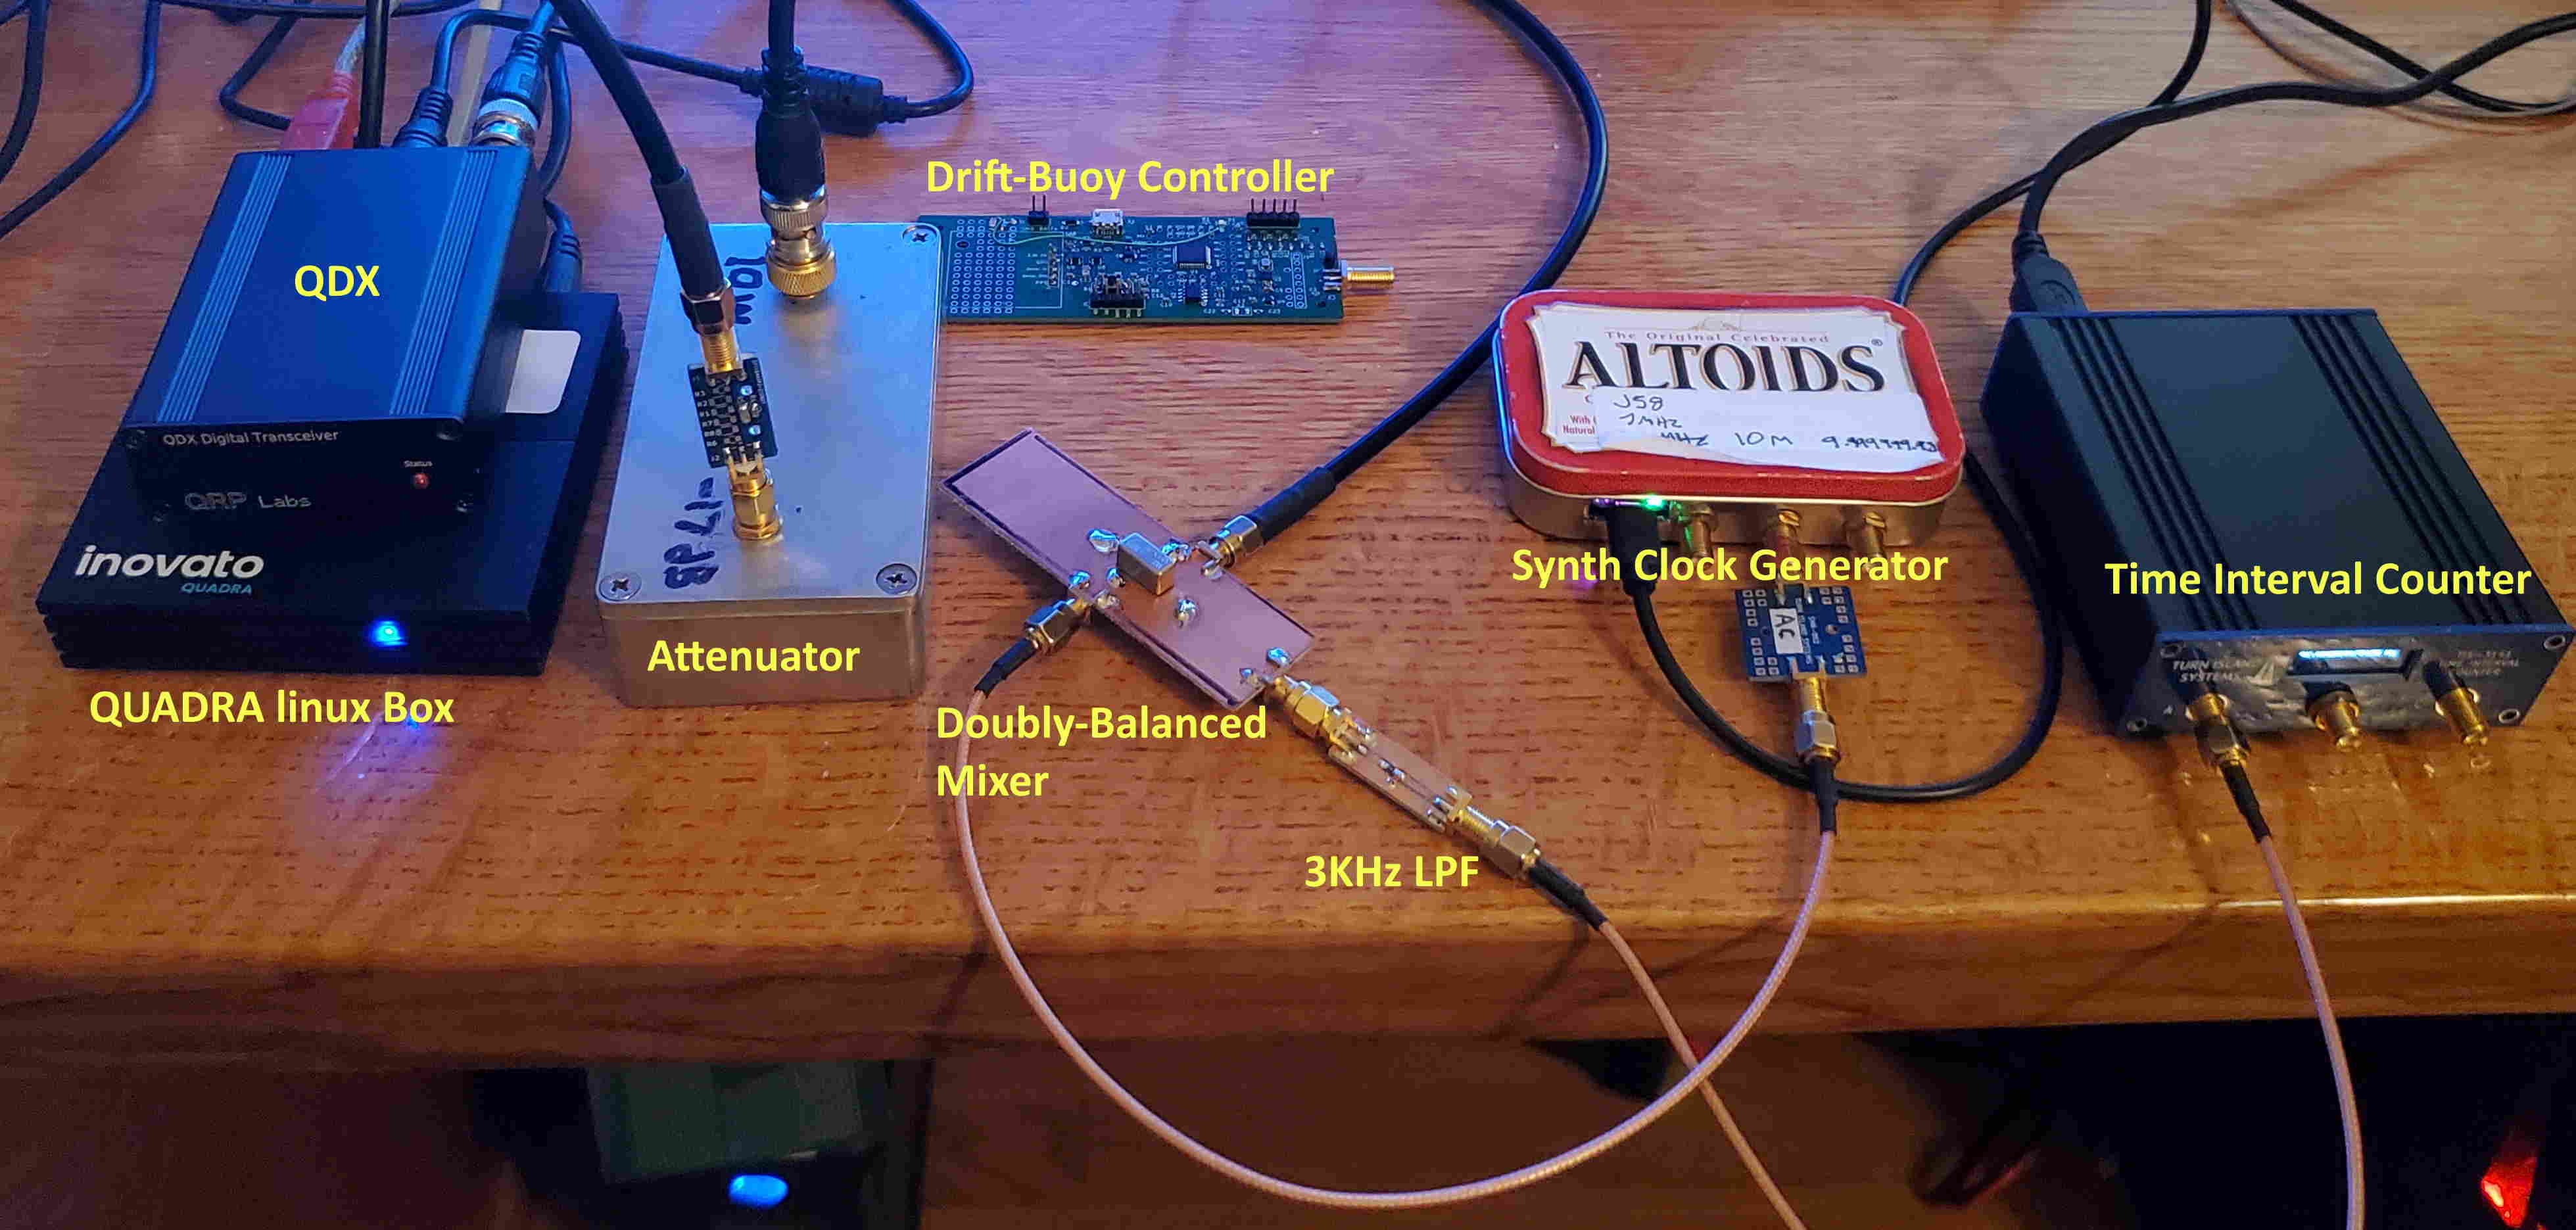
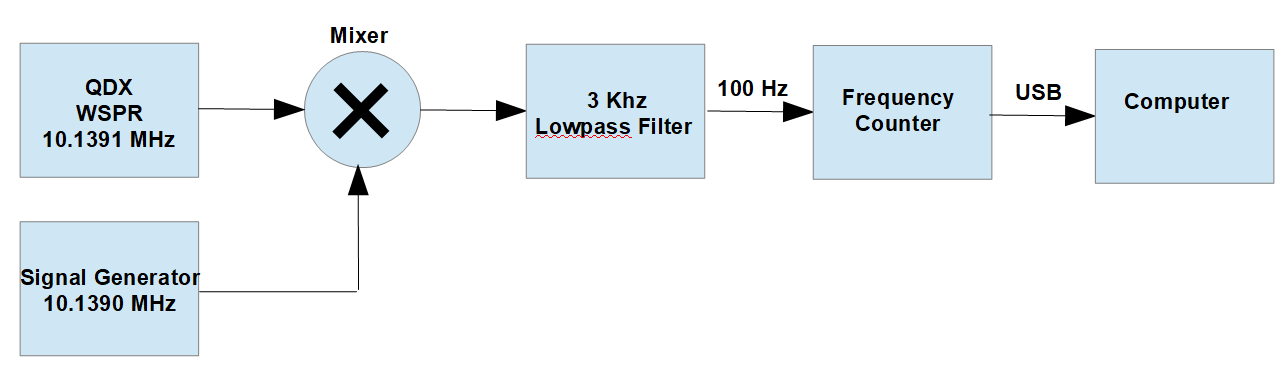
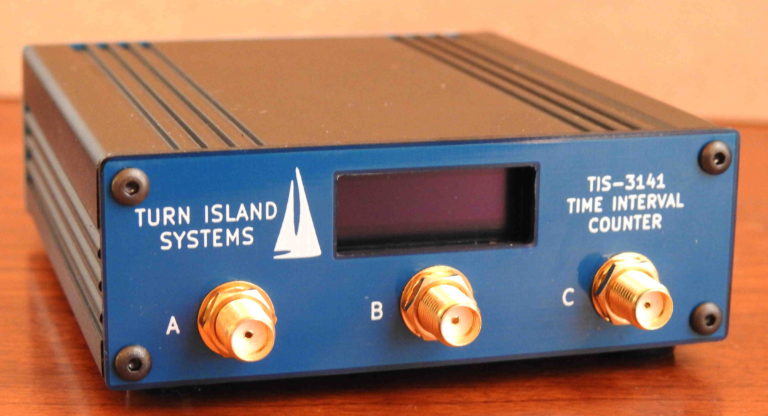
While evaluating the behavior of the QRP Labs QDX transceiver (my post here:  http://wb6cxc.com/?p=244 ), I put together an old-fashioned mixer / filter to let me make more accurate FSK frequency measurements.  I am using my Time Interval Counter, which counts the cycles of a 100 MHz (10 ns) internal timebase, and calculates the frequency of the input signal using simple math:

Frequency = 1 / Period

This works especially well for lower frequencies, where obtaining precise frequency results with a standard cycle-count counter requires extremely long measurement intervals.  The resolution of a reciprocal counter is a function of the timebase, in this case the 10ns timebase provides eight digits of precision with a one-second count interval (10ns / 1s = 1e-8)

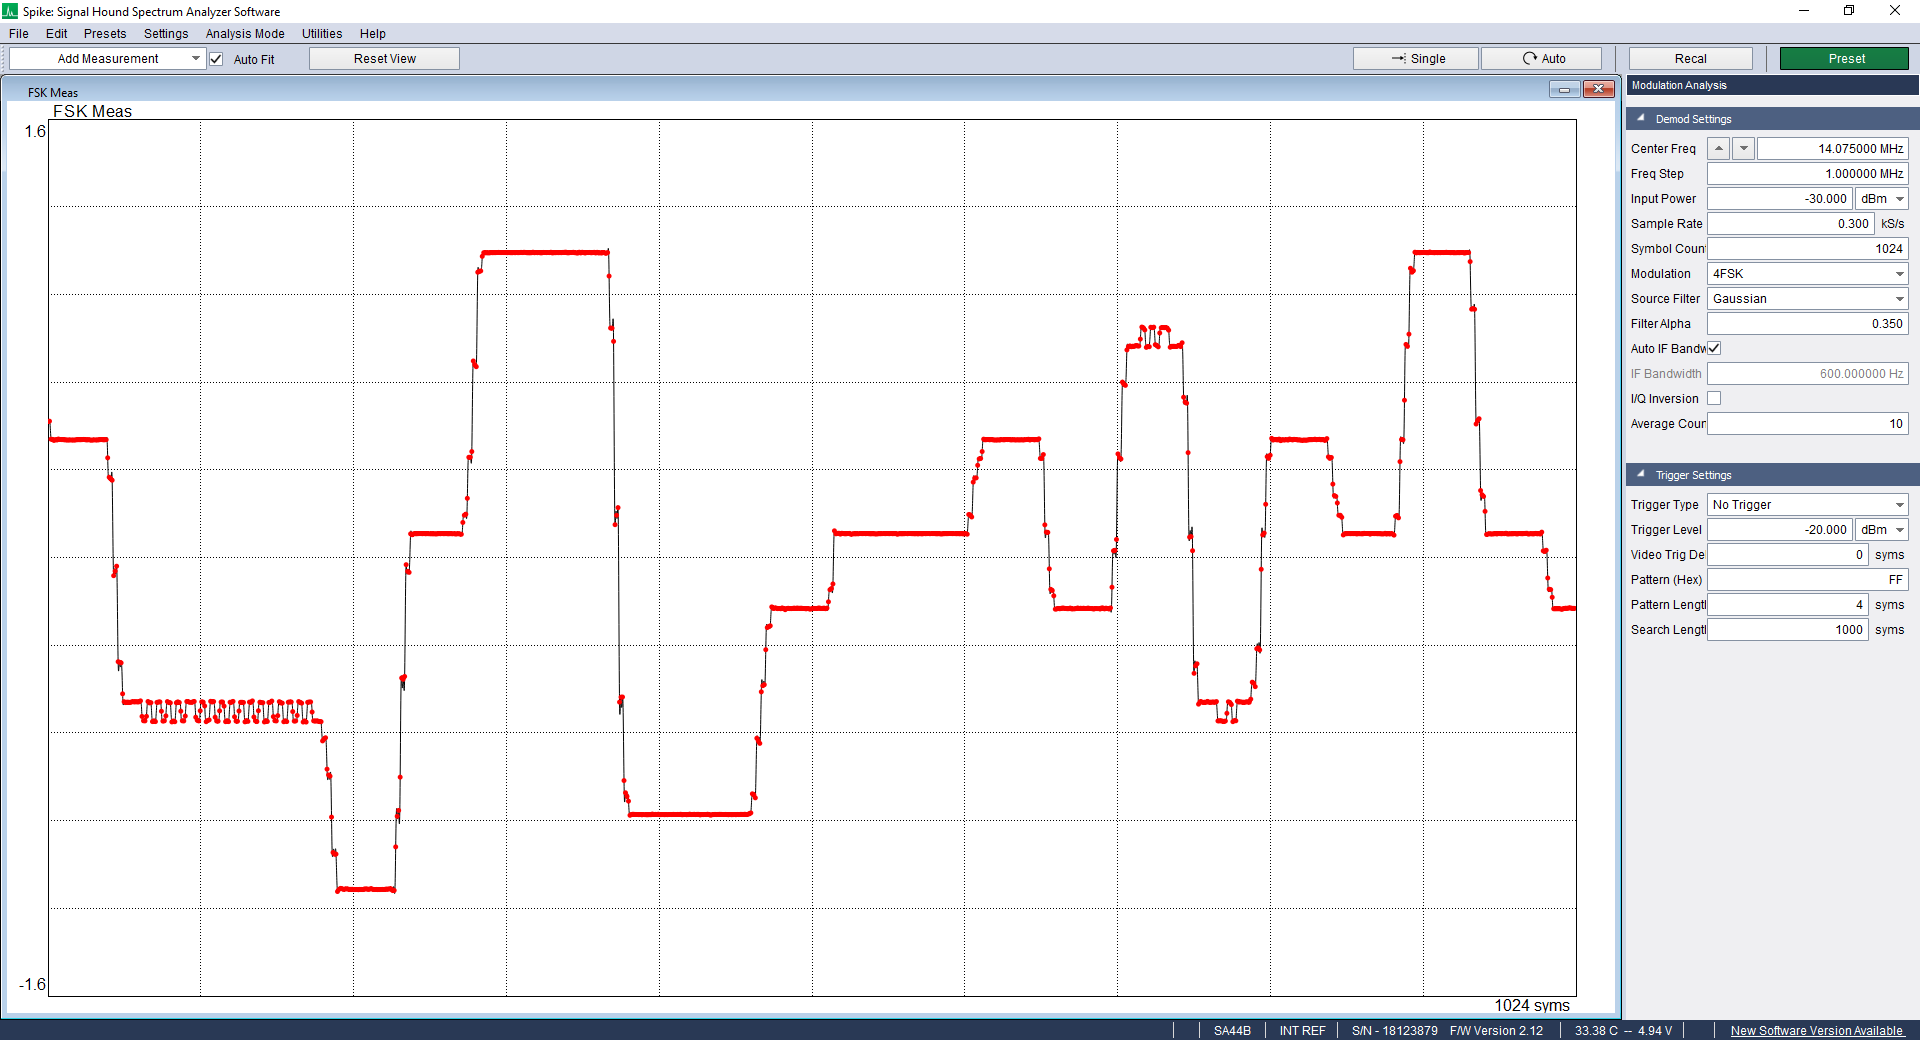
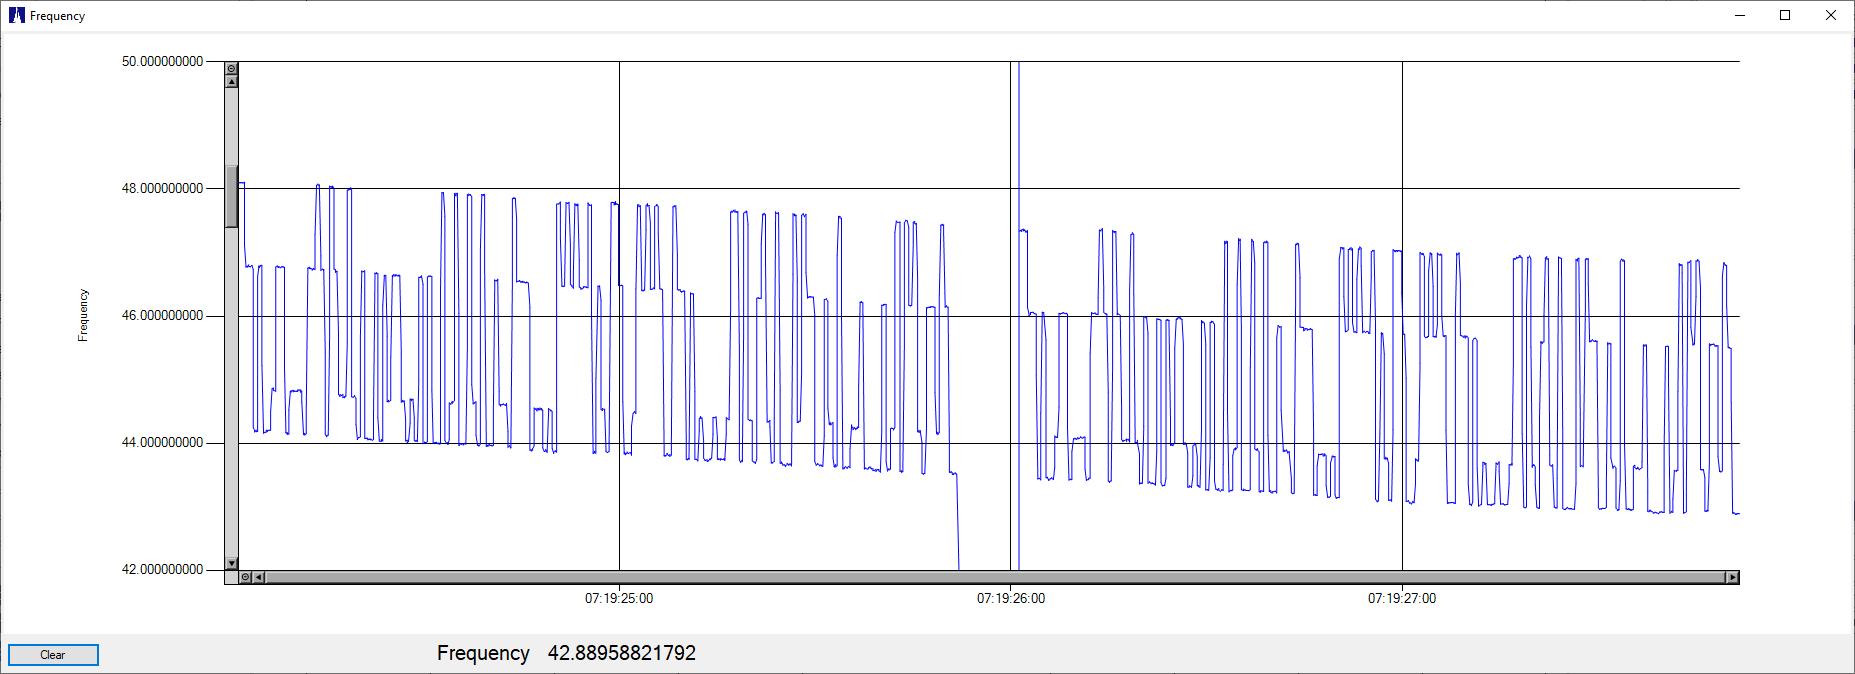
Eight digits is good, but when measuring 10.140 MHz WSPR, with its symbol rate of 1.4648 Hz we need to do better.  With three samples per symbol (about the slowest we can sample it), we only have (10ns/ 0.5s), or about 7.5 digits.  This lets us measure a 10.140 MHz signal to about 1/2 Hz resolution.  This will show us the presence of the modulation, but not much more:

Counter direct div2M

Using an external mixer and VFO to shift the 10 MHz signal down to 100 Hz makes a huge difference in measurement resolution.  With our 1/2 second sample rate we still have 7.5 digits of resolution, but since we a re measuring a 100 Hz signal the resolution is now about 0.00005 Hz!

Setup

But I don’t need an external mixer and VFO — all that can be done digitally inside the gate-array I use on my frequency counter:

TIC-1-768x416


So I added those to the FPGA logic: Timing Path 1


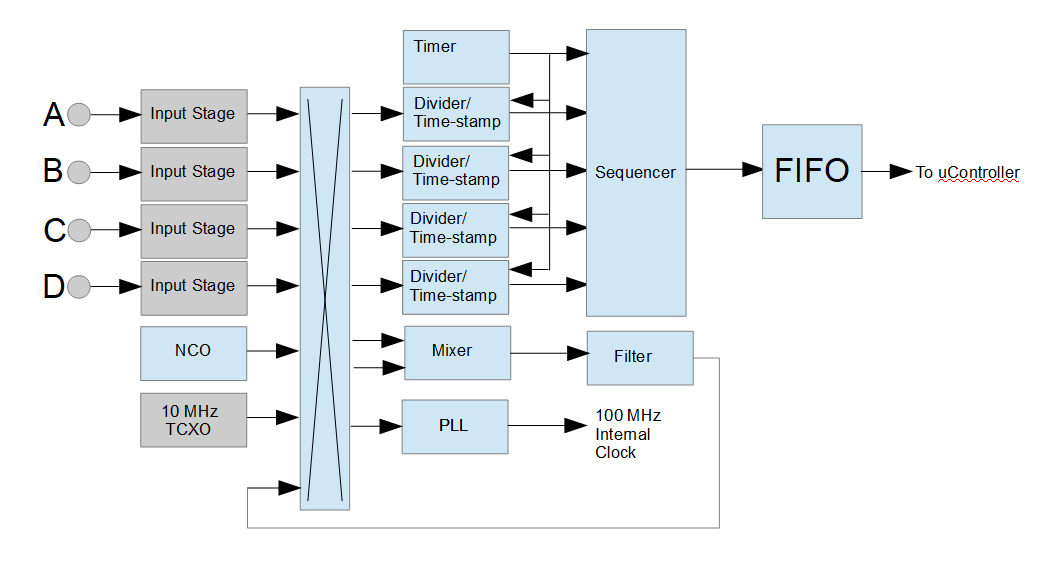
This is the block diagram of the signal path in the counter.  The blue boxes are contained in the gate-array, and the grey boxes are discrete components on the circuit board.  Not shown are the uController, and a few other sections inside the gate-array.

There are four input stages, configurable for 50-Ohm or High-Z input (compatible with a 10X ‘scope probe), AC or DC coupled.  Each stage, the NCO, the 10 MHz TCXO, and a few other sources (not shown) feed a N-way selector that feeds four divider/timestamp blocks.  The switch also allows any of the input ports to feed a 10 MHz reference clock to the internal 100 MHz PLL.  This allows the counter to use an external OCXO or GPS-disciplined oscillator for increased precision.  In addition, the switch selects the mixer inputs.

The NCO is driven by the 100 MHz clock, and is 29-bits wide.  This provides a frequency resolution of 100 MHz / 2e29, or 0.186xxx Hz, and a maximum frequency of 50 MHz.  The 100 MHz clock means there will be a jitter of 10ns in the NCO frequency.

The NCO or an external signal drives the “clock” of a simple flip-flop mixer, and the external signal feeds the “D” input  This acts as a subtractor.  With perfect input signals there will only be a difference output, there will be no sum as you would see with an analog double-balanced mixer (or with a digital XOR gate).  But we don’t have perfect inputs, as these have been sampled and synchronized by the 100 MHz internal counter clock.  There is plenty of jitter on these mixer inputs, and the output can look like this:

TEK0002 TEK0003
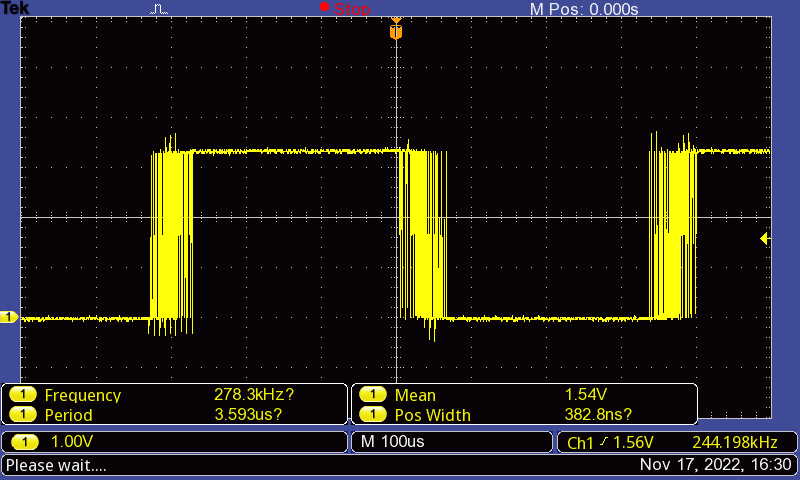
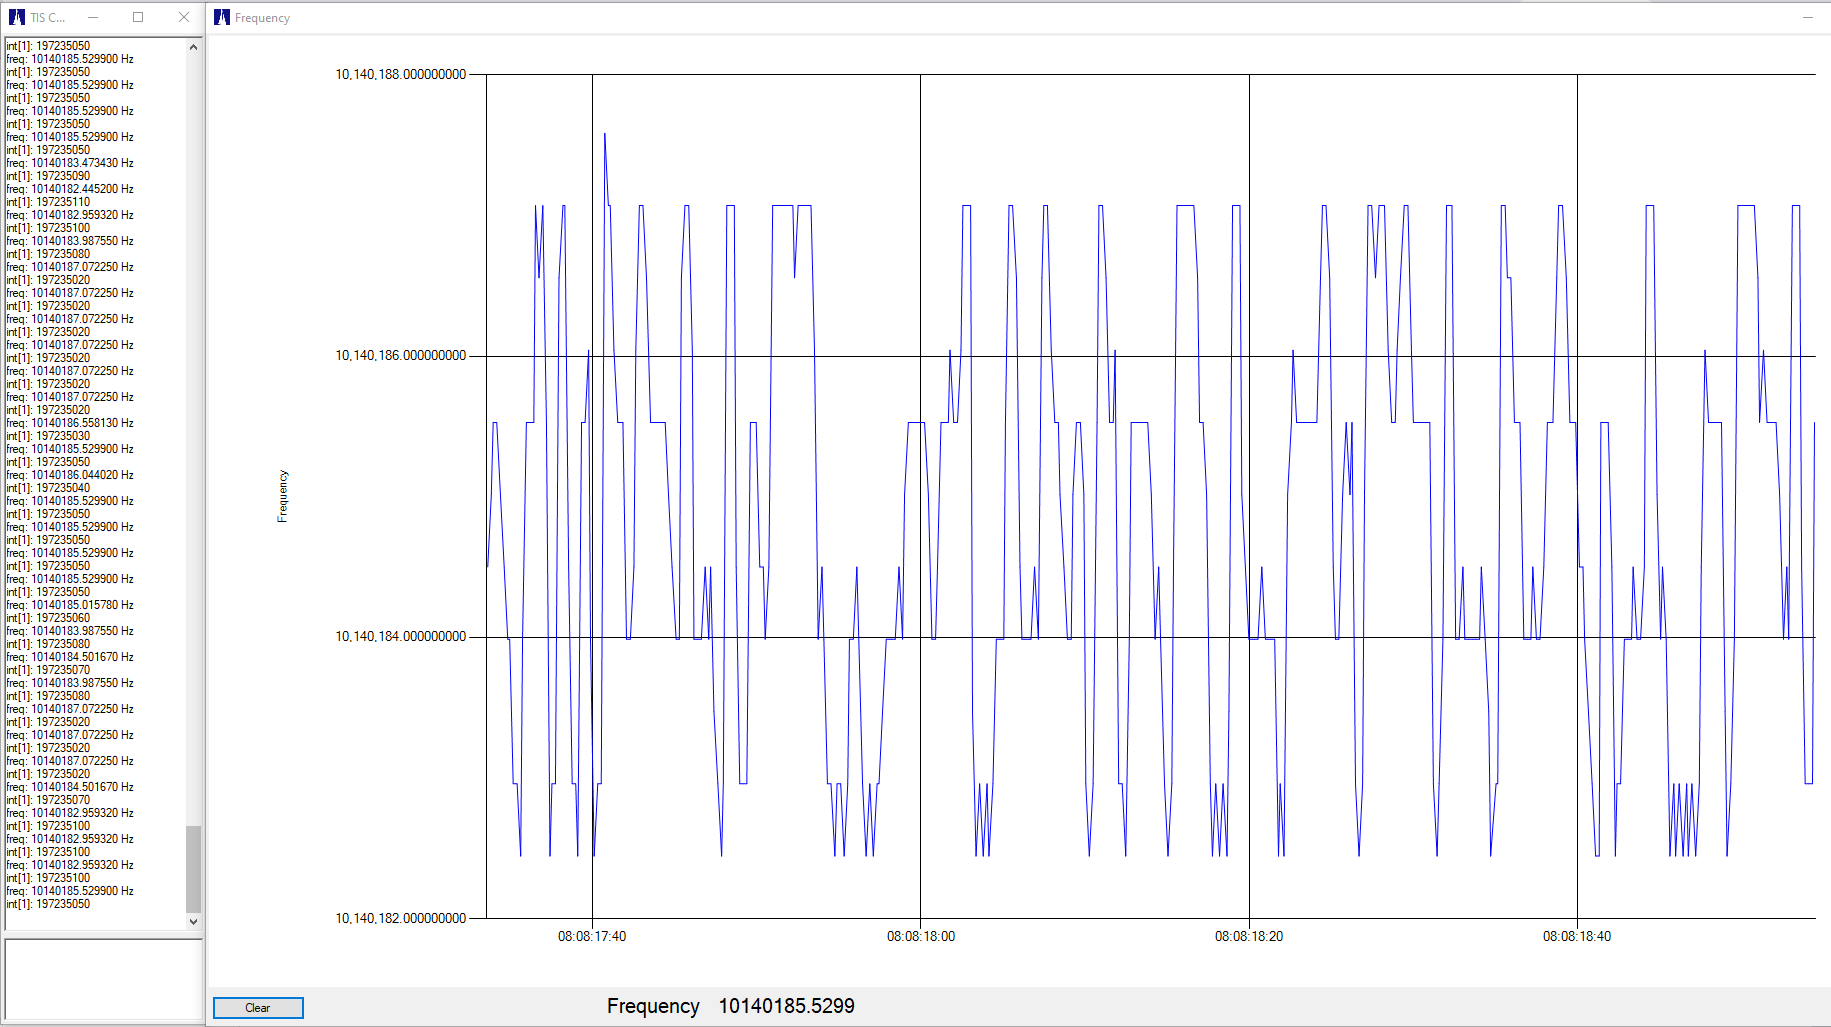
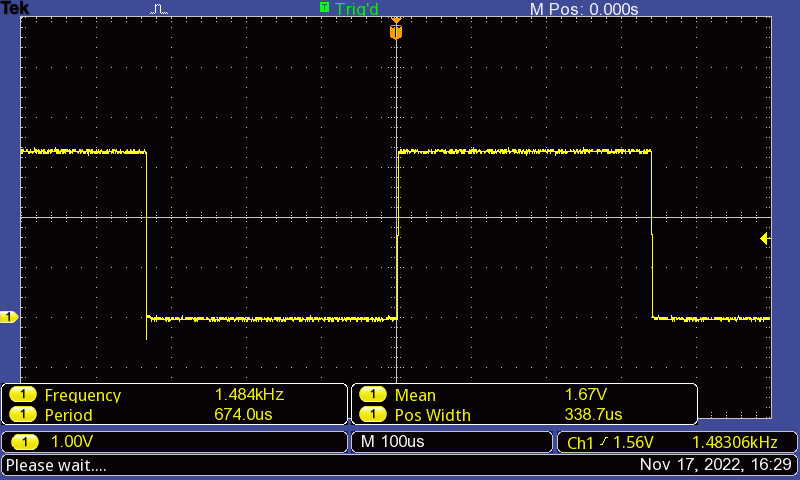
This isn’t a mixer difference frequency, it’s the result of jitter on (relatively) close frequencies.  Here the input is 10.14018 MHz and the NCO is running at 10.1387 MHz, giving a 1.483 KHz difference frequency.  But we can’t count that mess!

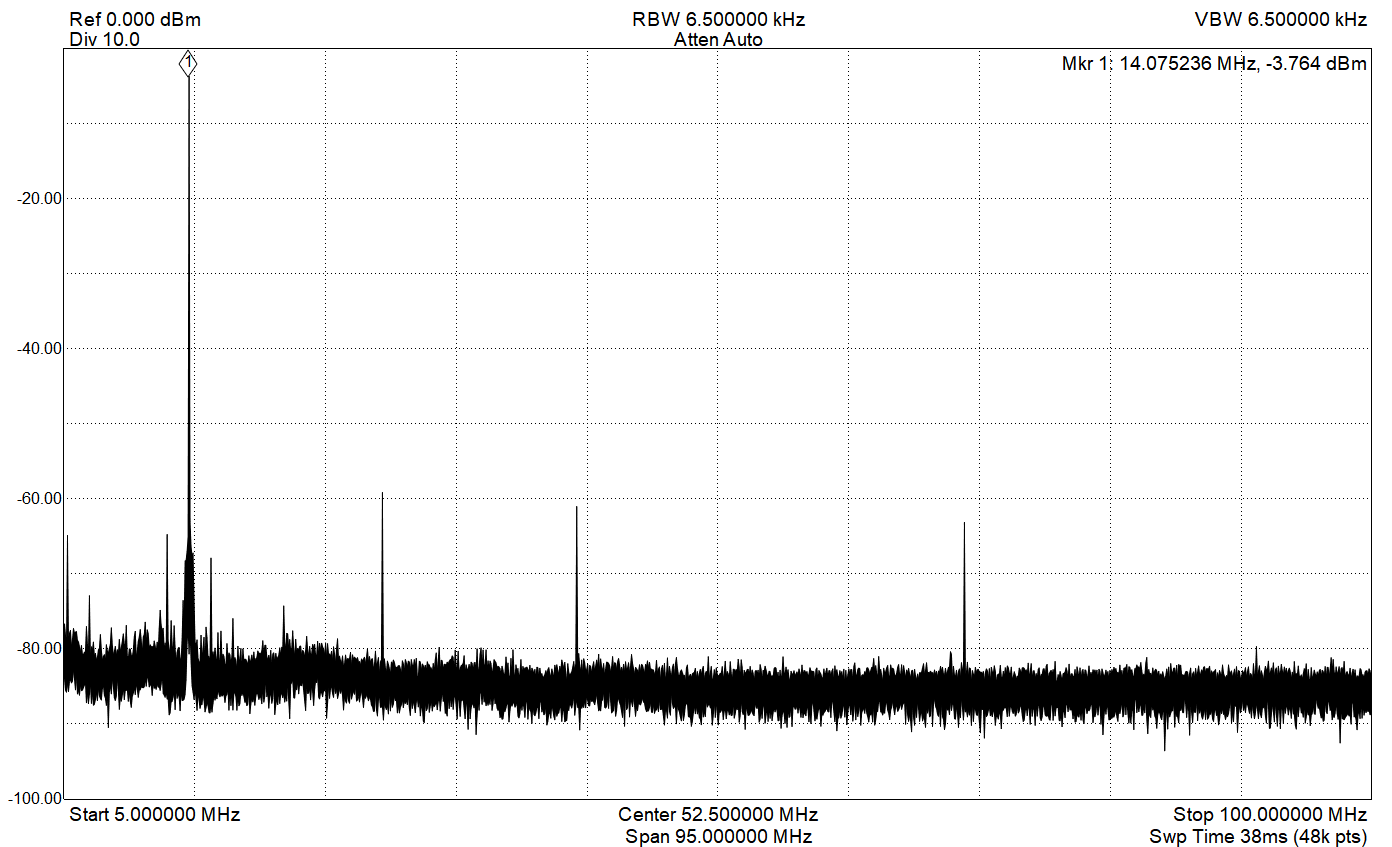
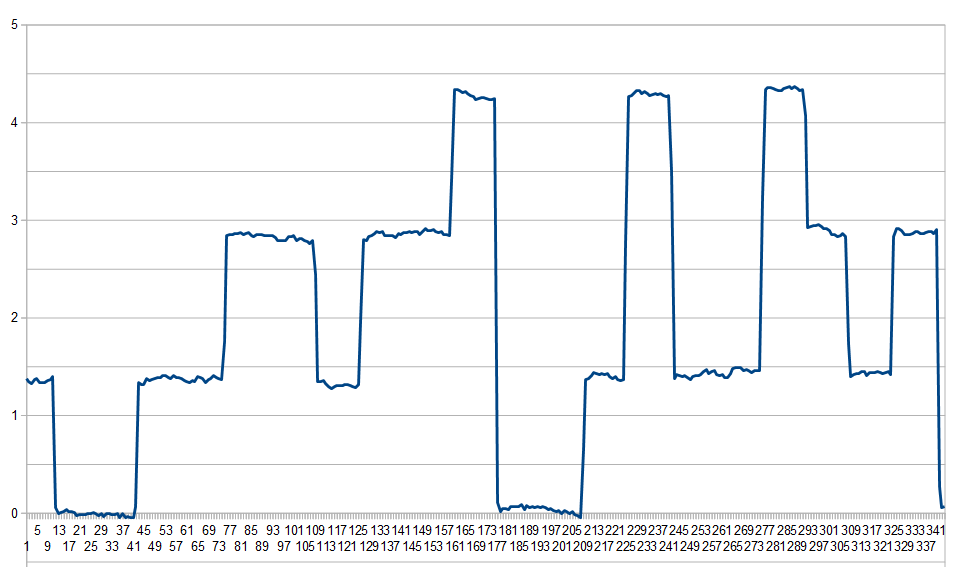
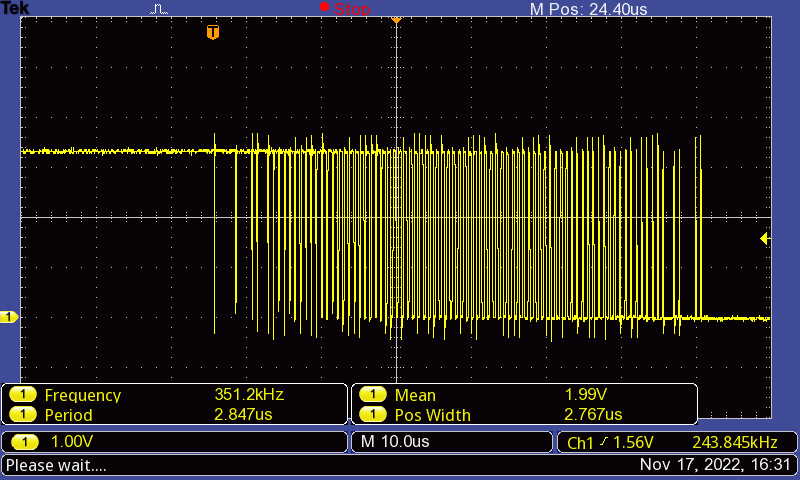
So I added a simple digital filter after the mixer.  This is a simple 8-bit up/down counter that limits at 0 and 255.  It’s essentially an integrator, counting up when the input is a “1″ and counting down when the input is “0″.  The output goes high when the count hits 255, and stays high until the count hits 0.  This results in a low-pass filter with a cutoff frequency of (100 MHz / 255) / 2, or 196 KHz.  Here’s that same noisy mixer output after it passes through the filter:

TEK0001

This cleaned-up signal is then fed to one of the divider/timestamp stages and the timestamps are read by the uController, converted to frequency,  and then sent over the counter serial port for logging or further processing.  This serial port can only handle report rates of about 50 per second, so the divider has to be set appropriately.  With a 1KHz mixer output the divider is set to 5 for a 50 Hz sample rate (or set to 100 for a 10 Hz rate.)

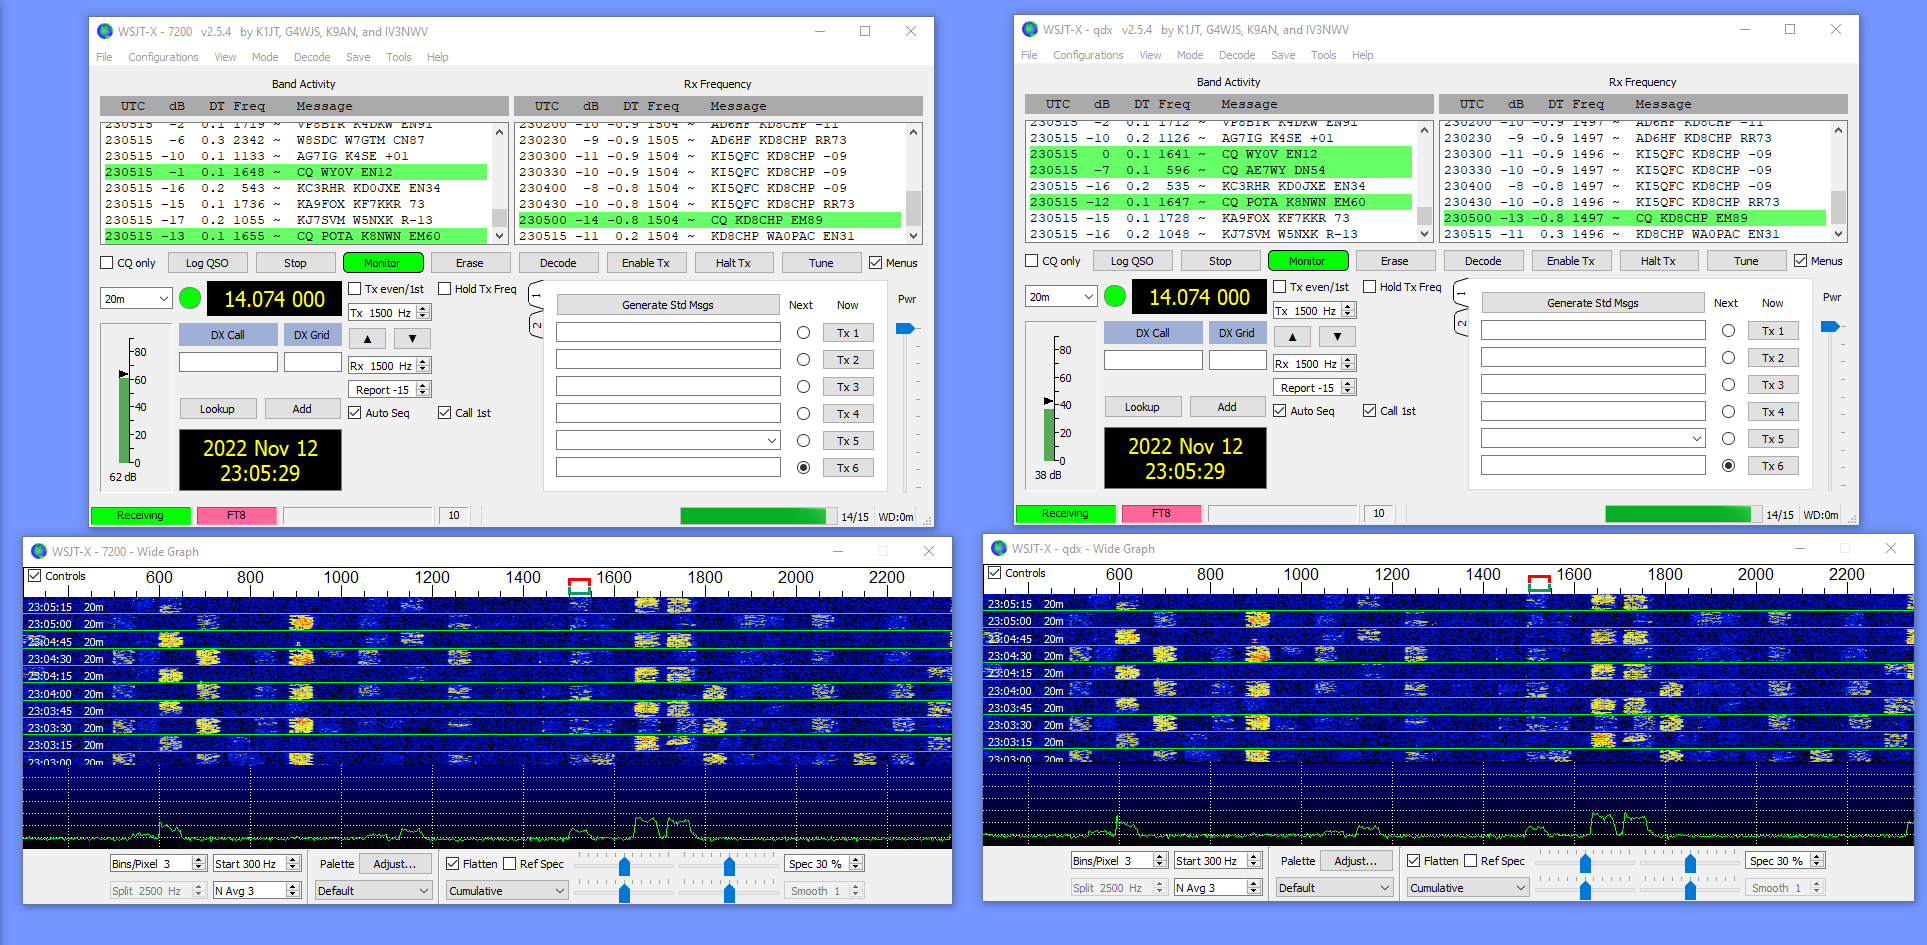
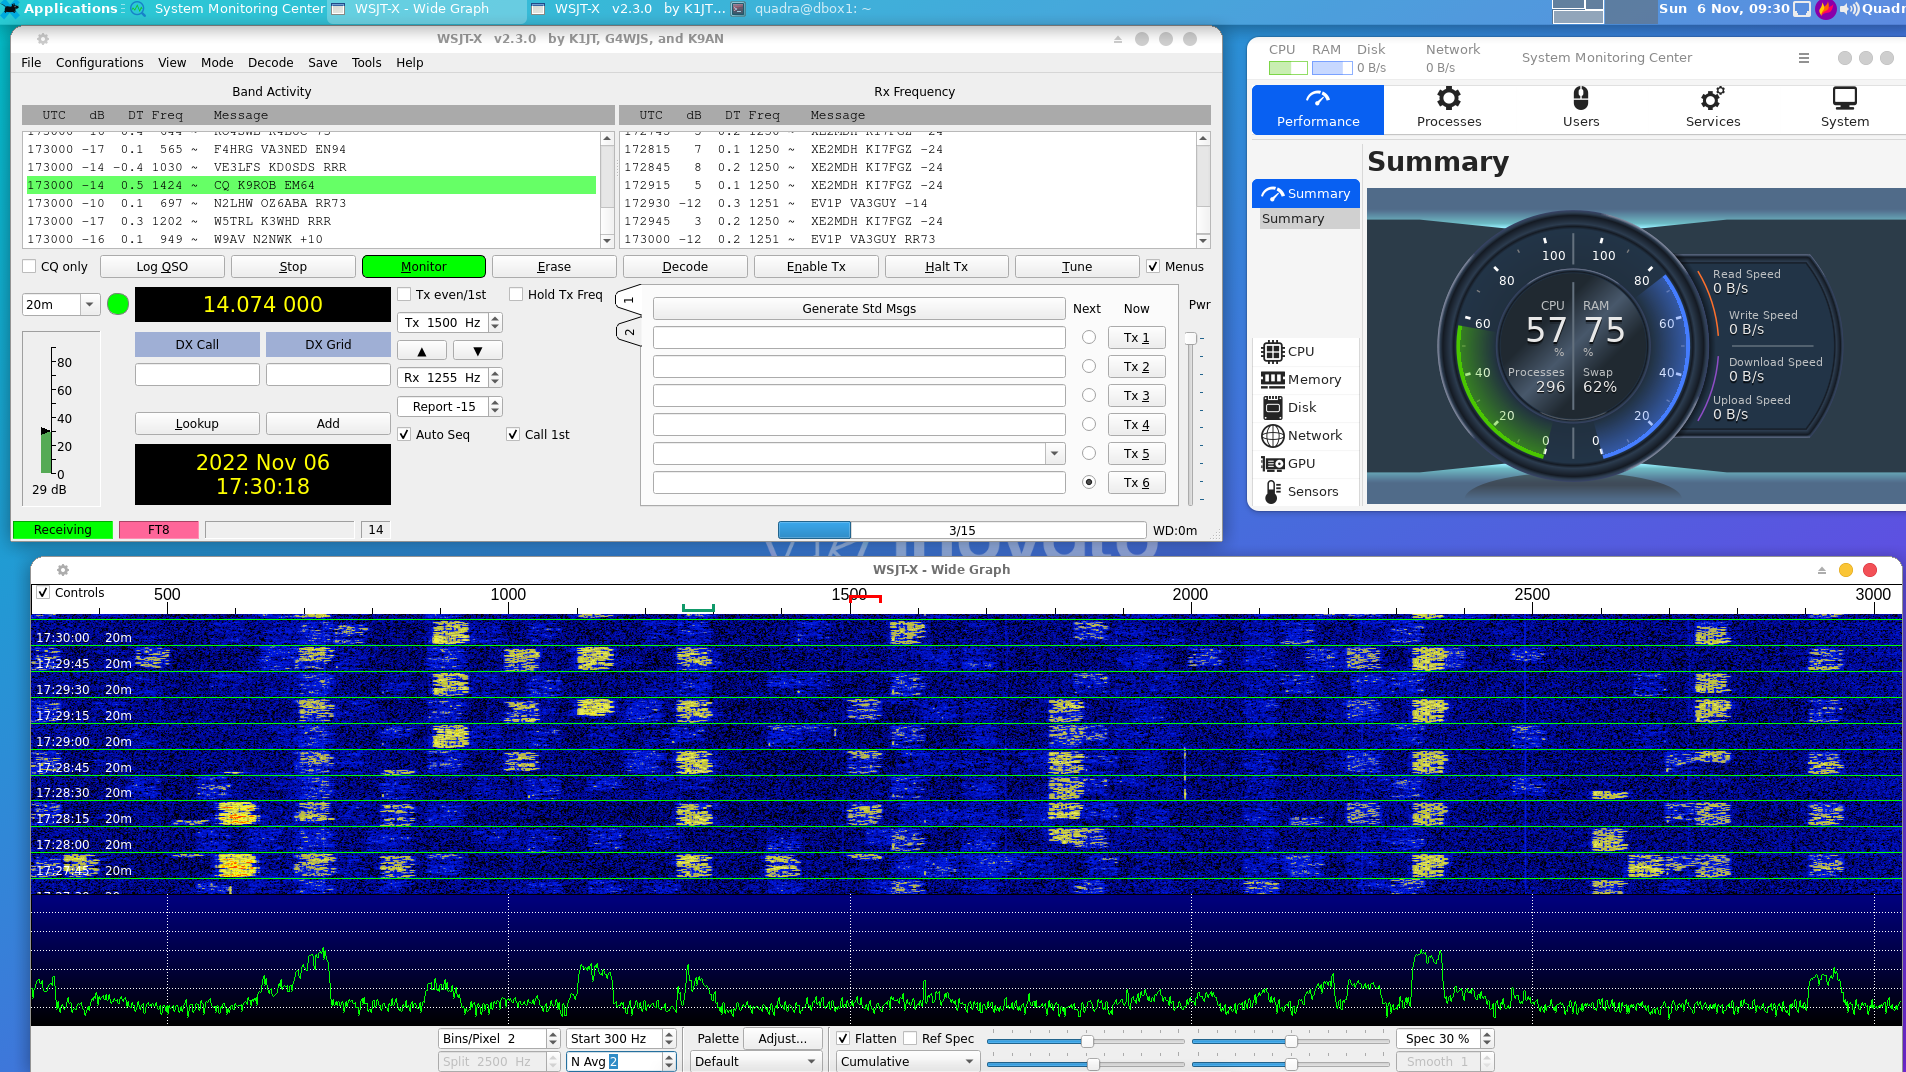
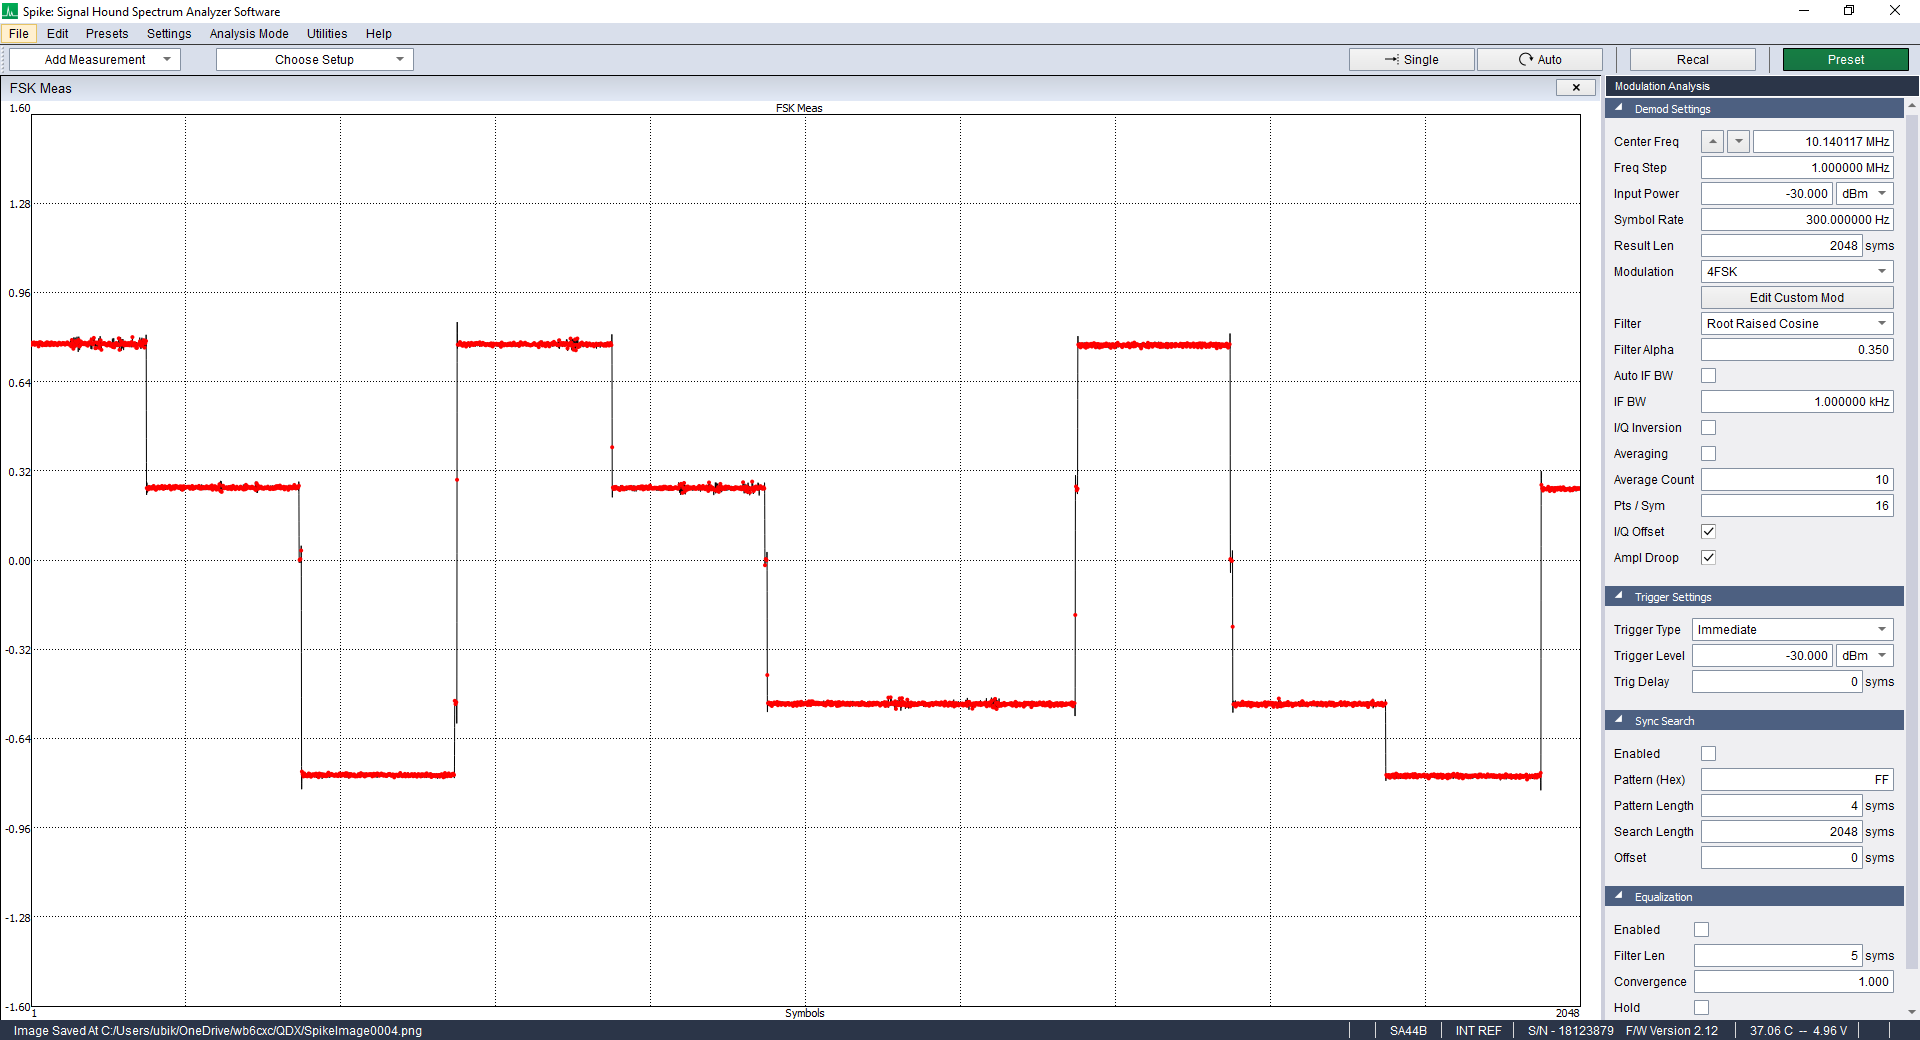
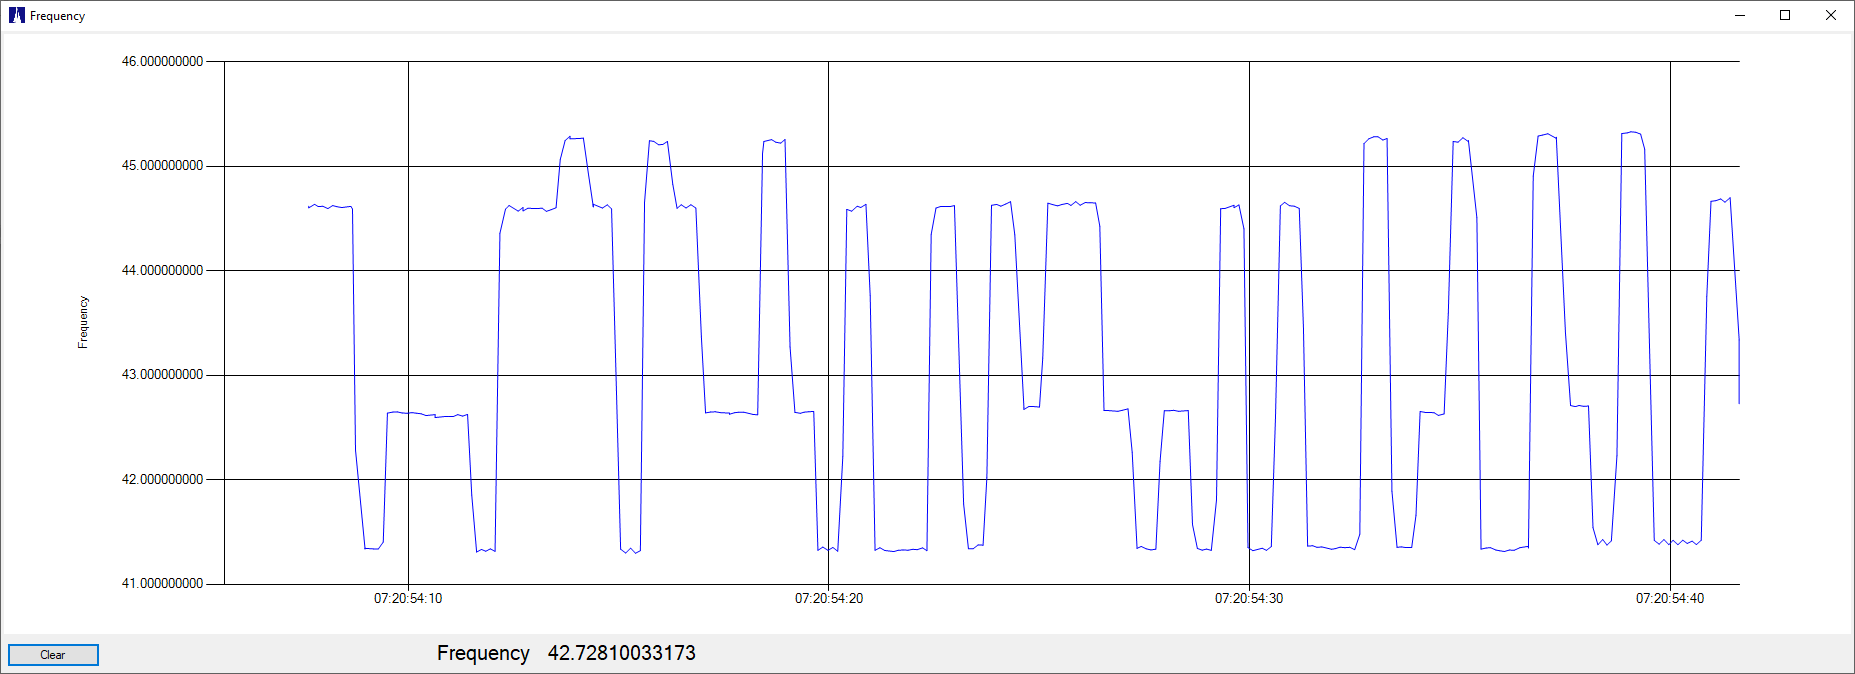
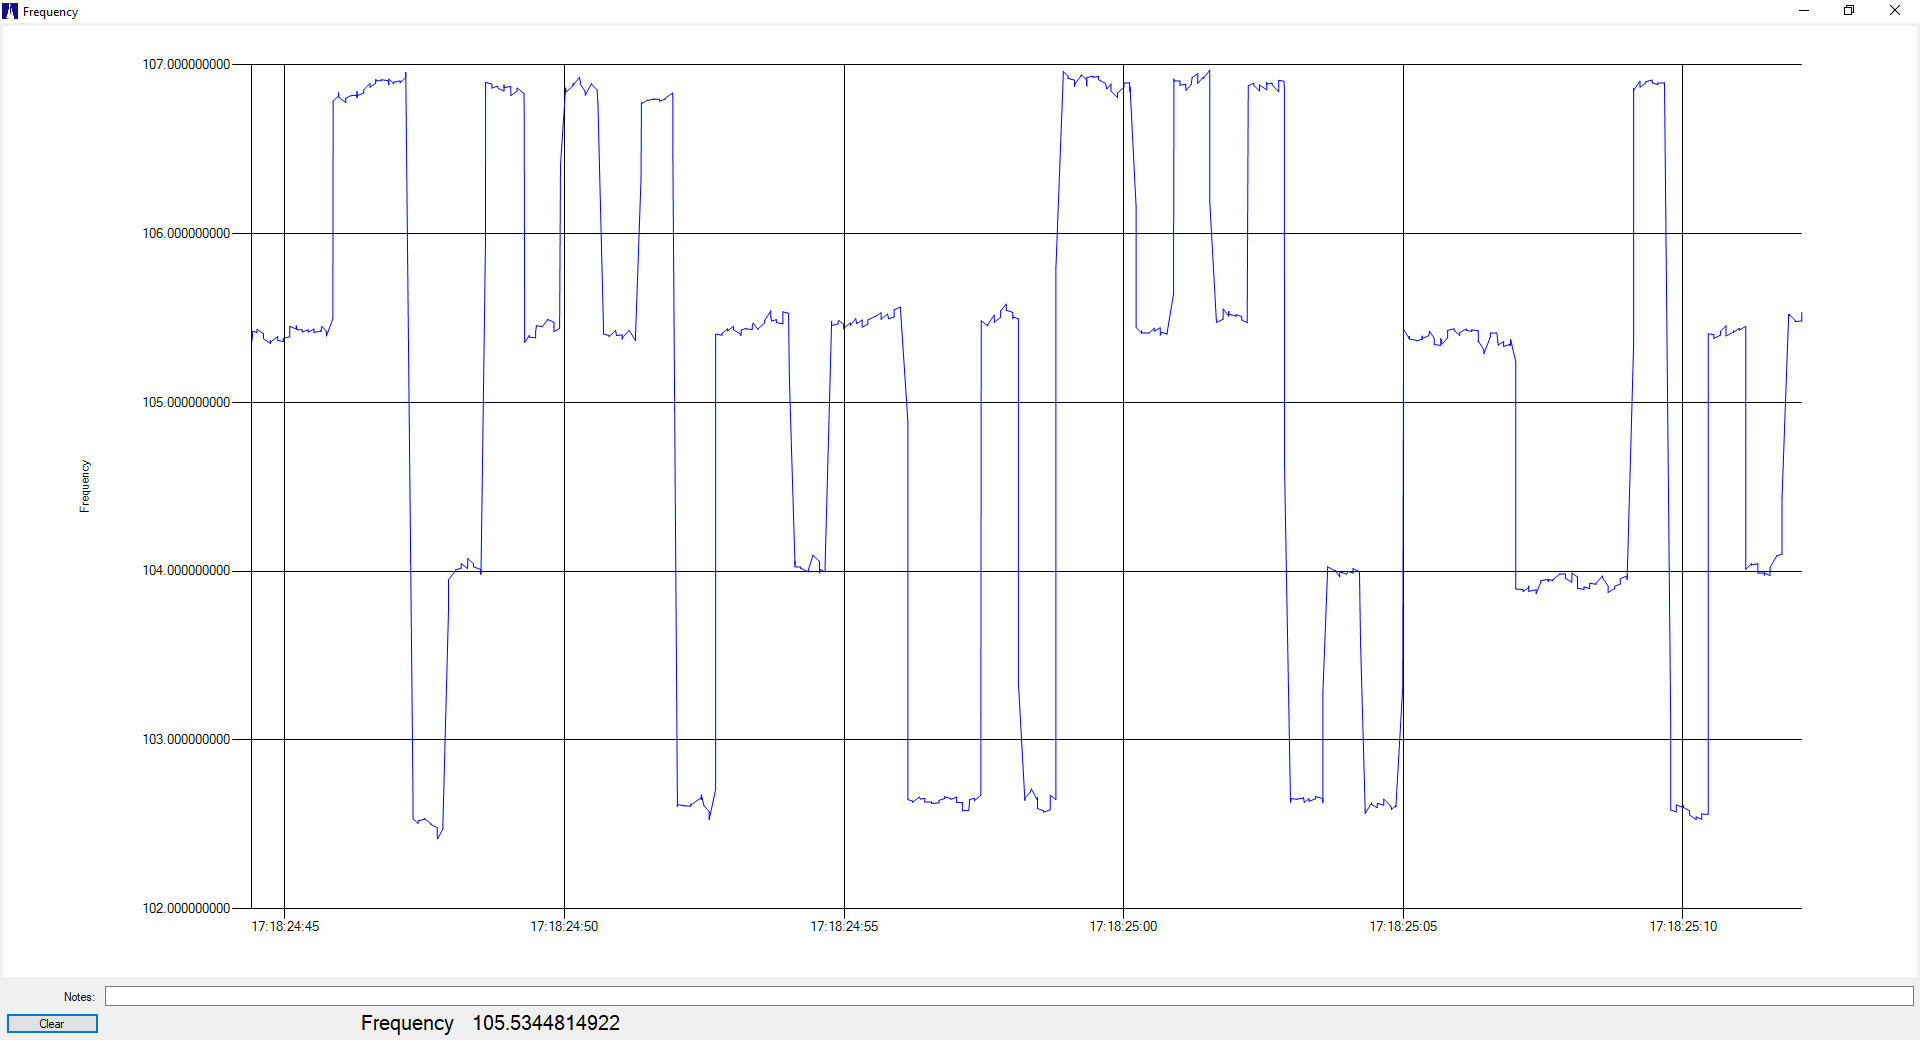
Here is a 10.140 MHz WSPR measurement, with the NCO set for a difference frequency of about 100 Hz.  The divider is set to 5, giving a sample rate of about 20 Hz:

wspr 2
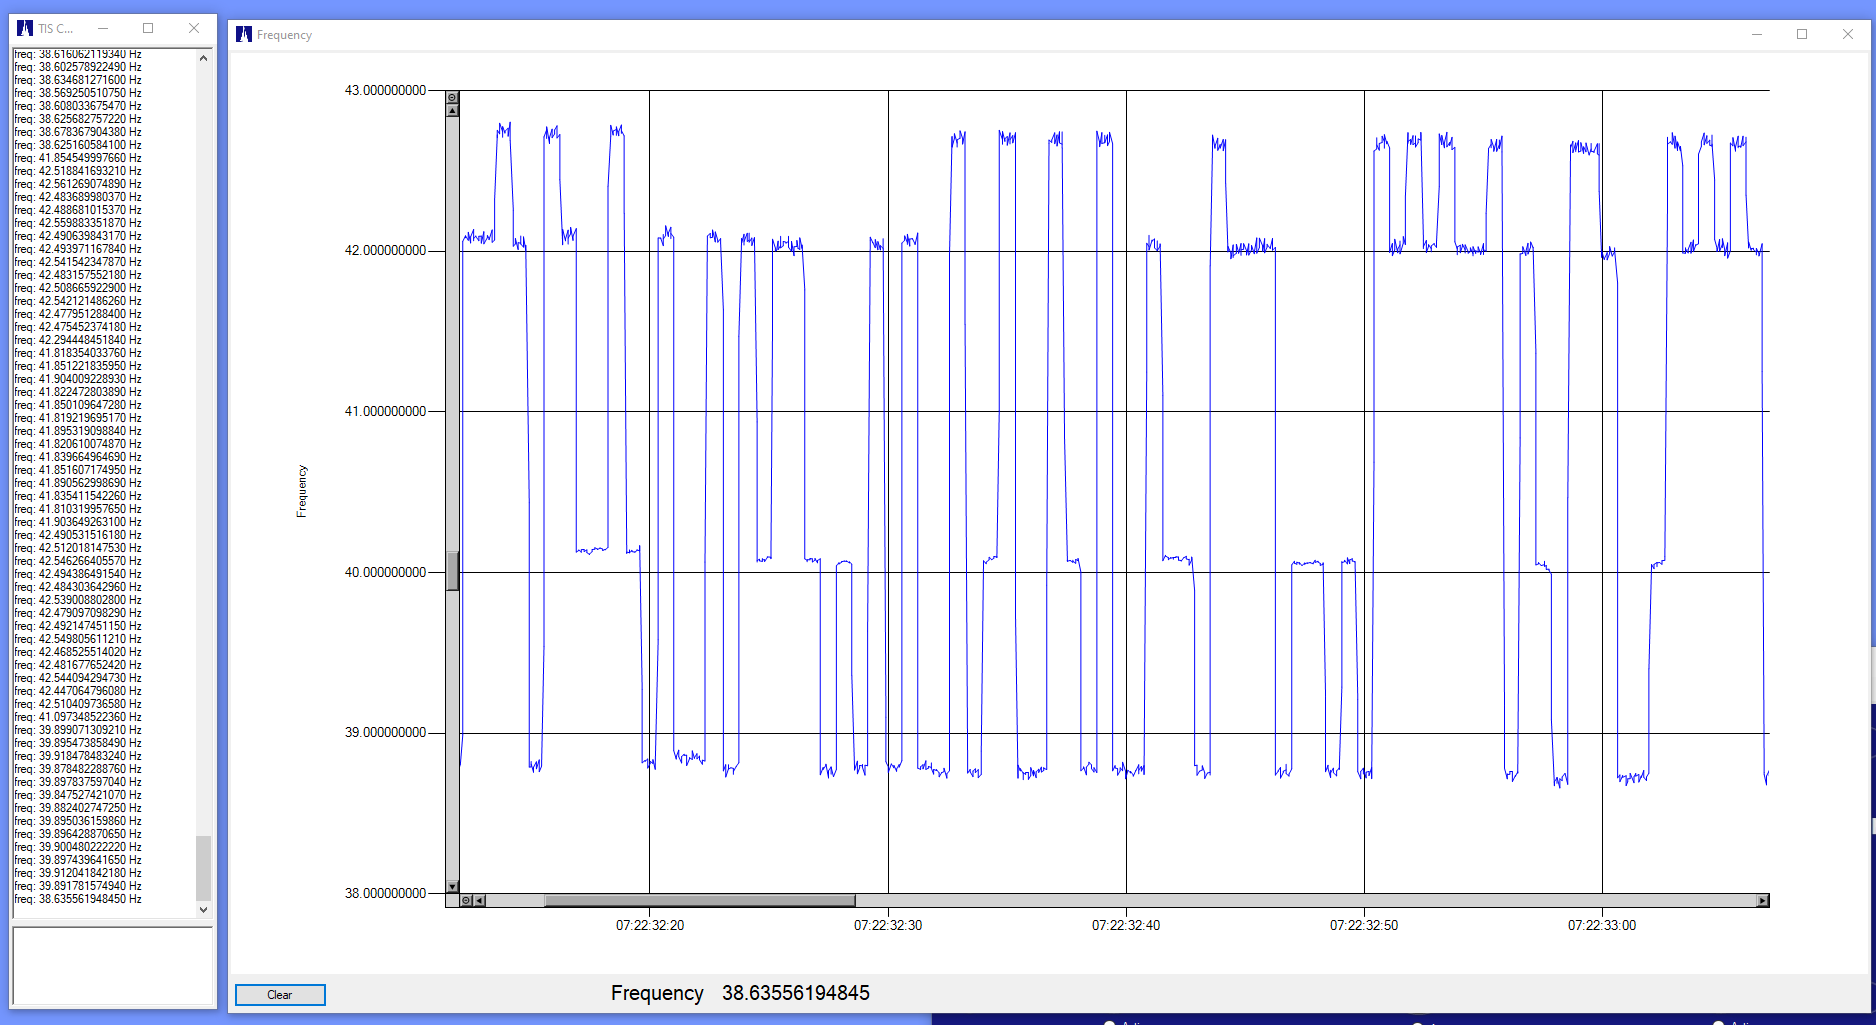
And here are some of the actual frequency measurements:

flist 2

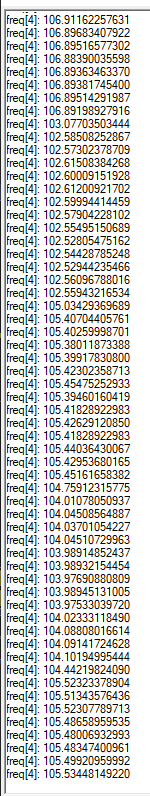
Note that only about seven digits are actually meaningful, but that’s still quite useful.

And unless I decide to do more processing with the local uController, because of the slow serial port update rate this mixer down-conversion method is only useful for fairly low-speed FSK measurements.  Of course this is also useful when making other low-bandwidth measurements, such as clock drift.

And there’s still room left inside the FPGA!  What’s next???


DX with the QDX

DXThis morning I was chatting on 40 meters with a local JS8 operator , about 50 miles distant, and was monitoring PSKreporter to see where the little 3W signal from the QDX was showing up.

How about Australia!  I don’t know if this is technically “gray line” propagation, but I am impressed!


QDX Sensitivity Test

I still haven’t done a full evaluation of the QRP Labs QDX transceiver, but I did run a quick check of the receiver performance, comparing it to the Icom IC-7200 (which also has a native  USB interface for audio and CAT control):

ComparisonHere you see two instances of WSJTX, running FT8 on 20 meters.  My off-center-dipole was connected to a coax TEE, feeding both the QDX and the 7200.  No effort was made to match impedances, but since both radios are getting an identical signal that should be good enough for a comparison.  Obviously the transmitters were not activated during this test.

I let the programs run for fifteen minutes and then compared the logfiles.  The7200 logged 524 decodes, while the QDX logged  530.  The Signal/Noise ratio was generally the same, with the QDX showing one or two dB improvement on the stronger signals.  These small differences may be due to the AGC or the slightly narrower filters on the Icom rig.

This test was done if a fairly quiet location, with no nearby strong signals.

Conclusion:  So far, the QDX receiver is a good performer.


Building and Testing the QRP Labs QDX Digital Transceiver

I recently built the QRP Labs QDX transceiver,  which is a remarkable little radio, designed for FSK modes (FT8, JS8, WSPR, etc.)  on the 80-20 meter ham bands.QDX-2This rig has some very clever design inside.  Instead of the standard SSB modulator and demodulator, this uses a USB interface for audio and CAT rig control (emulating a Kenwood TS-440), and measures the audio input tone, using that measured audio frequency and the set “carrier” frequency to program the internal Si5351 clock chip.  This way it directly generates the transmit frequency — no sideband modulator / filter, no linear amplifier, just the synthesizer and an efficient Class-D 5W power amplifier.

On receive, the radio uses a “Tayloe” mixer, using the Si5351 to generate the necessary quadrature clocks.  The I and Q mixer outputs are digitized and processed in a software SSB demodulator.  This digital audio is sent out the USB interface, to a program such as WSJTX.

There’s much worth studying in this design and Hans Summers (the designer) has provided some excellent documentation:

https://www.qrp-labs.com/qdx.html

It took me about three hours to build this radio.  The kit comes with all the surface-mount components already loaded, so I only had to solder a handful of capacitors and wind some toroids.

QDX-1

There has been some discussion about the four power transistors — they do run a bit warm and people have burned them out trying for higher power (or due to bad SWR).  I ran the transmitter into a dummy load for about two minutes and measured the transistor temperatures.  This had stabilized at about 50 degrees C:

QDX 2 minutes TX


The signal transmitted by this radio is clean, with harmonics well under the FCC requirements (those close-in spurs may not actually be there.  The spectrum analyzer I was using has some spurious responses of its own):20m 1

After this I gave the radio a spin on 20 meters, using WSJTX running on a small, inexpensive linux box, the Inovato “QUADRA”.  This little computer is comparable to the Raspberry Pi-3, and only costs $30 (power supply and HDMI cable included).  I installed JS8CALL, WSJTX, and Direwolf using the command-line “sudo apt-get install [program name]“, and everything went without a hitch.  Running FT8 for a few minutes resulted in this:

QUADRA-WSJTX-QDX

FT8-20m

A friend had noted that the QDX wasn’t perfectly generating some of the smaller frequency shifts used in some FSK modes.  Hans has acknowledged the problem and is working on a firmware update, but I decided to look into this.  First I used my “Signalhound USB-SA44B” spectrum analyzer, in the modulation analysis mode.  FT8 looked good:

QDX FT8 mod 1

Note the frequency dither, as the QDX can’t decide on which frequency to send.  This should have absolutely no impact on performance.  8-FSK FT8 uses a tone-spacing of 6.25 Hz.

WSPR was next, and there are issues here.  The 4-FSK WSPR tone spacing is a narrower 1.456 Hz, and the QDX has difficulty generating these evenly-spaced tones.  Here is the analyzer modulation display for 30 meter WSPR:

4FSK Measurement

Notice how the tone frequency steps aren’t even.  Tone 1 should be halfway between tone 0 and tone 2 (and it isn’t).  I wasn’t able to measure exact tone frequencies with the modulation analyzer mode, so I put together a different test setup:

Setup


This technique mixes the output of the transmitter with a fixed-frequency signal generator, and the resulting difference frequency can be measured by a frequency counter.  I used a Time Interval Counter of my own design that does “reciprocal” counting where the period of the input signal is measured with 10ns resolution, resulting in fast and accurate measurement, especially for low frequency inputs.  These measurements are sent to a PC where they can be plotted and analyzed.

Modulation Measurement Setup

I had all the pieces lying around except for my low-pass filter, for which I put a simple R-C netwotk (470 Ohms series, 0.1uF shunt) and some SMA connectors on a bit of circuit board.  That Altoids tin contains a simple Si5351 clock generator, a tiny controller, and a not-particularly-stable crystal oscillator.

So here are some measurement results:

Meas Screen

This was done with the mixing generator set about 40 Hz lower than the QDX WSPR transmission.  The counter is pre-dividing the 40Hz difference frequency by four, resulting in a measurement rate of about 10Hz.  This gives about 14 or 15 samples per WSPR symbol.  Here we can see the same problem with the QDX frequency setting — this time it’s Tone 2 that is shifted.  The specifics of the shift or frequency error depends on the actual audio frequency coming in to the QDX (sent my WSJTX).  Here is the modulation with the WSPR transmit offset at 1404Hz (I believe that slow frequency shift is the QDX as it warms up, but I should test that using a better frequency reference):

Counter-QDX-1404


Note that the step error is at the low-frequency end.  Incrementing the audio frequencies by 1 Hz gives us this with the error at the upper frequency end:

Counter-QDX-1405

I saw the same error-vs-audio-frequency behavior as when using the spectrum analyzer modulation test.  As another check, I used my drift-buoy controller/synthesizer as a WSPR source (here, generating random WSPR -4FSK tones, and the measurements put into a spreadsheet in order to zero-reference the frequencies):

Counter-BuoyThe tone frequencies are correct.

The QDX  displays this WSPR frequency issue on both 30 and 20 meters,  and I assume on the other bands as well.  I have used the QDX to successfully transmit WSPR, so this amount of error isn’t necessarily critical, but I look forward to enhanced performance in the near future.

For what it’s worth, the Time Interval Counter (TIC) I am using (and designed) is able to directly measure the WSPR modulation at the 10.140… MHz carrier frequency, without using the fancy mixing / down-conversion arrangement:

Counter direct div2M

Here the TIC has pre-divided the 10.xxx MHz input frequency by 2,000,000 which gives us about five measurements per second, about the slowest rate that will reasonably measure 1.456 Hz symbol rate of WSPR.  With the 10 ns resolution of the TIC, this  results in frequency measurements with about 1/2 Hz resolution.  This is good enough to show the modulation, but not good enough to accurately measure it.

The down-conversion method, by directly mixing the 10.xxx MHz signal down to about 100Hz, provides a single-cycle frequency resolution of about 0.0001 Hz.  Since I am measuring four cycles, that gives 0.000025 Hz resolution, certainly enough to accurately measure WSPR deviation!